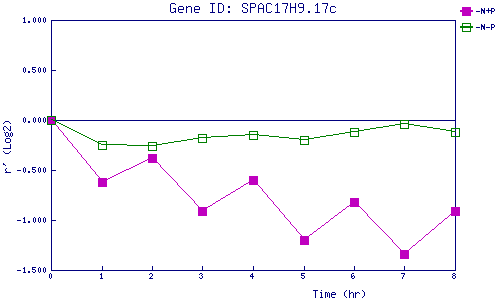
| 0 | 1 | 2 | 3 | 4 | 5 | 6 | 7 | 8 | |
| -N+P | 0.000 | -0.617 | -0.378 | -0.912 | -0.605 | -1.204 | -0.815 | -1.341 | -0.910 |
| -N-P | 0.000 | -0.254 | -0.263 | -0.181 | -0.148 | -0.199 | -0.119 | -0.040 | -0.124 |
|
-N+P: Nitrogen starved in the presence of P-factor -N-P: Nitrogen starved in the absence of P-factor |