cki3
| 0 | 1 | 2 | 3 | 4 | 5 | 6 | 7 | 8 | |
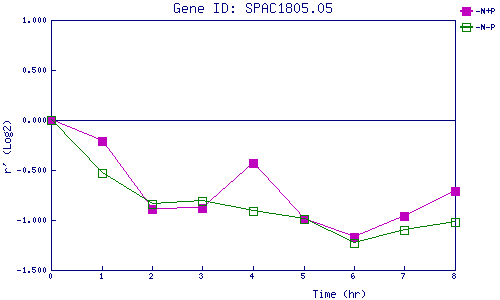
| -N+P | 0.000 | -0.210 | -0.894 | -0.877 | -0.430 | -0.989 | -1.174 | -0.955 | -0.710 |
| -N-P | 0.000 | -0.533 | -0.843 | -0.811 | -0.912 | -0.992 | -1.228 | -1.100 | -1.016 |
|
-N+P: Nitrogen starved in the presence of P-factor -N-P: Nitrogen starved in the absence of P-factor |