hem2
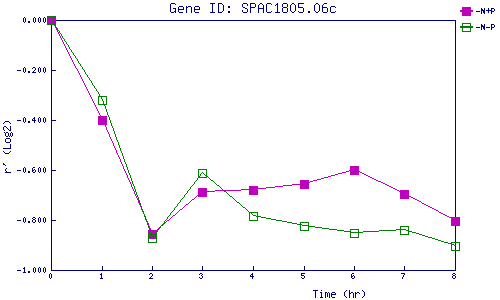
| 0 | 1 | 2 | 3 | 4 | 5 | 6 | 7 | 8 | |
| -N+P | 0.000 | -0.400 | -0.854 | -0.689 | -0.680 | -0.654 | -0.598 | -0.698 | -0.804 |
| -N-P | 0.000 | -0.322 | -0.870 | -0.613 | -0.786 | -0.823 | -0.852 | -0.841 | -0.902 |
|
-N+P: Nitrogen starved in the presence of P-factor -N-P: Nitrogen starved in the absence of P-factor |