rps26-2 rps2602
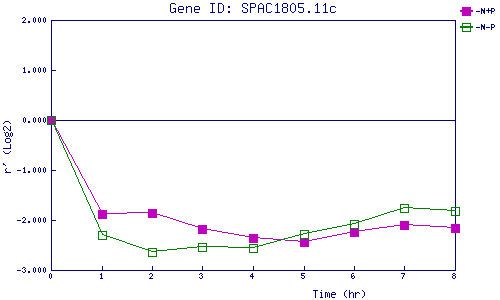
| 0 | 1 | 2 | 3 | 4 | 5 | 6 | 7 | 8 | |
| -N+P | 0.000 | -1.872 | -1.852 | -2.189 | -2.363 | -2.435 | -2.239 | -2.104 | -2.152 |
| -N-P | 0.000 | -2.296 | -2.637 | -2.536 | -2.551 | -2.276 | -2.077 | -1.750 | -1.827 |
|
-N+P: Nitrogen starved in the presence of P-factor -N-P: Nitrogen starved in the absence of P-factor |