uep1 ubi2
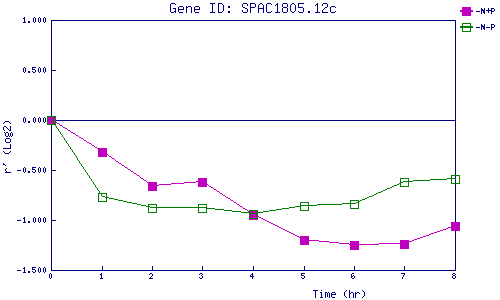
| 0 | 1 | 2 | 3 | 4 | 5 | 6 | 7 | 8 | |
| -N+P | 0.000 | -0.316 | -0.661 | -0.618 | -0.949 | -1.197 | -1.253 | -1.241 | -1.059 |
| -N-P | 0.000 | -0.767 | -0.880 | -0.882 | -0.942 | -0.857 | -0.839 | -0.616 | -0.589 |
|
-N+P: Nitrogen starved in the presence of P-factor -N-P: Nitrogen starved in the absence of P-factor |