rpl14
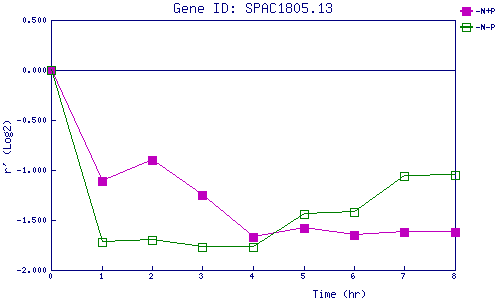
| 0 | 1 | 2 | 3 | 4 | 5 | 6 | 7 | 8 | |
| -N+P | 0.000 | -1.114 | -0.899 | -1.249 | -1.670 | -1.576 | -1.651 | -1.622 | -1.620 |
| -N-P | 0.000 | -1.716 | -1.699 | -1.769 | -1.766 | -1.435 | -1.420 | -1.061 | -1.054 |
|
-N+P: Nitrogen starved in the presence of P-factor -N-P: Nitrogen starved in the absence of P-factor |