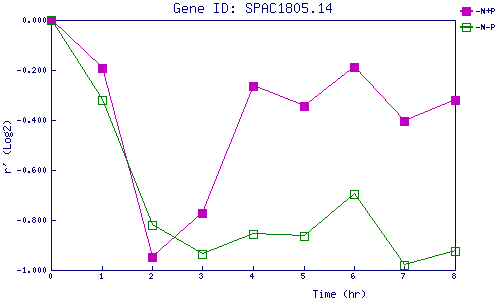
| 0 | 1 | 2 | 3 | 4 | 5 | 6 | 7 | 8 | |
| -N+P | 0.000 | -0.190 | -0.949 | -0.773 | -0.265 | -0.346 | -0.189 | -0.403 | -0.322 |
| -N-P | 0.000 | -0.322 | -0.821 | -0.937 | -0.858 | -0.863 | -0.695 | -0.981 | -0.925 |
|
-N+P: Nitrogen starved in the presence of P-factor -N-P: Nitrogen starved in the absence of P-factor |