pub2
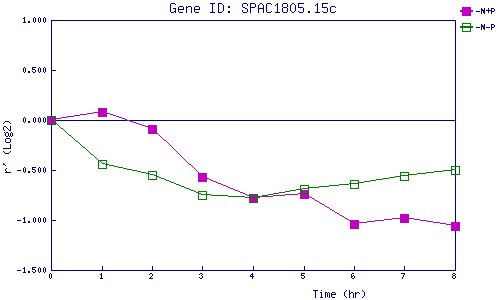
| 0 | 1 | 2 | 3 | 4 | 5 | 6 | 7 | 8 | |
| -N+P | 0.000 | 0.082 | -0.093 | -0.568 | -0.777 | -0.739 | -1.037 | -0.983 | -1.059 |
| -N-P | 0.000 | -0.445 | -0.552 | -0.750 | -0.784 | -0.690 | -0.639 | -0.559 | -0.503 |
|
-N+P: Nitrogen starved in the presence of P-factor -N-P: Nitrogen starved in the absence of P-factor |