sup45
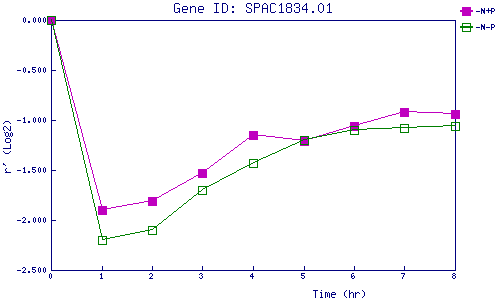
| 0 | 1 | 2 | 3 | 4 | 5 | 6 | 7 | 8 | |
| -N+P | 0.000 | -1.904 | -1.808 | -1.531 | -1.154 | -1.214 | -1.063 | -0.921 | -0.940 |
| -N-P | 0.000 | -2.200 | -2.105 | -1.702 | -1.431 | -1.200 | -1.098 | -1.081 | -1.061 |
|
-N+P: Nitrogen starved in the presence of P-factor -N-P: Nitrogen starved in the absence of P-factor |