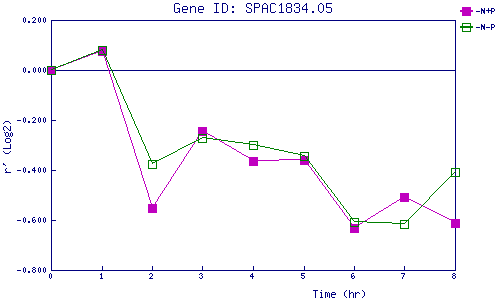
| 0 | 1 | 2 | 3 | 4 | 5 | 6 | 7 | 8 | |
| -N+P | 0.000 | 0.076 | -0.553 | -0.245 | -0.364 | -0.360 | -0.634 | -0.507 | -0.612 |
| -N-P | 0.000 | 0.080 | -0.376 | -0.274 | -0.299 | -0.346 | -0.610 | -0.616 | -0.409 |
|
-N+P: Nitrogen starved in the presence of P-factor -N-P: Nitrogen starved in the absence of P-factor |