krp1 klp3
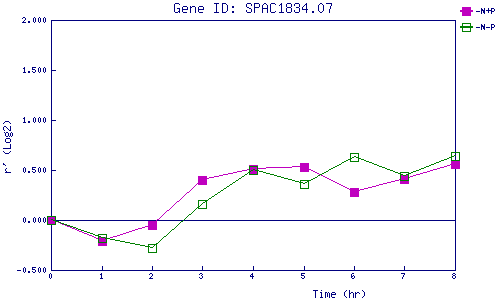
| 0 | 1 | 2 | 3 | 4 | 5 | 6 | 7 | 8 | |
| -N+P | 0.000 | -0.211 | -0.048 | 0.395 | 0.513 | 0.530 | 0.280 | 0.406 | 0.563 |
| -N-P | 0.000 | -0.184 | -0.282 | 0.165 | 0.505 | 0.361 | 0.628 | 0.442 | 0.635 |
|
-N+P: Nitrogen starved in the presence of P-factor -N-P: Nitrogen starved in the absence of P-factor |