| 0 | 1 | 2 | 3 | 4 | 5 | 6 | 7 | 8 | |
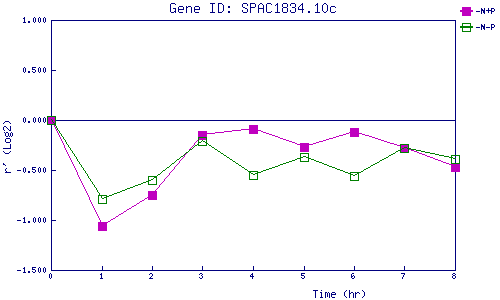
| -N+P | 0.000 | -1.055 | -0.752 | -0.150 | -0.093 | -0.269 | -0.125 | -0.276 | -0.467 |
| -N-P | 0.000 | -0.786 | -0.595 | -0.207 | -0.546 | -0.367 | -0.565 | -0.279 | -0.389 |
|
-N+P: Nitrogen starved in the presence of P-factor -N-P: Nitrogen starved in the absence of P-factor |