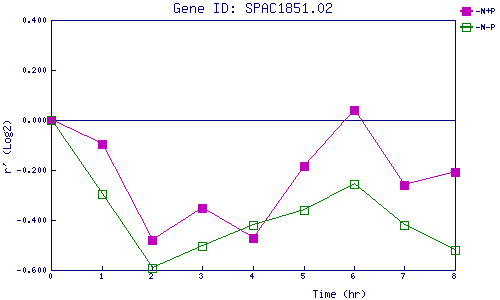
| 0 | 1 | 2 | 3 | 4 | 5 | 6 | 7 | 8 | |
| -N+P | 0.000 | -0.095 | -0.478 | -0.350 | -0.470 | -0.184 | 0.038 | -0.260 | -0.209 |
| -N-P | 0.000 | -0.296 | -0.592 | -0.505 | -0.420 | -0.361 | -0.255 | -0.420 | -0.520 |
|
-N+P: Nitrogen starved in the presence of P-factor -N-P: Nitrogen starved in the absence of P-factor |