ckb1
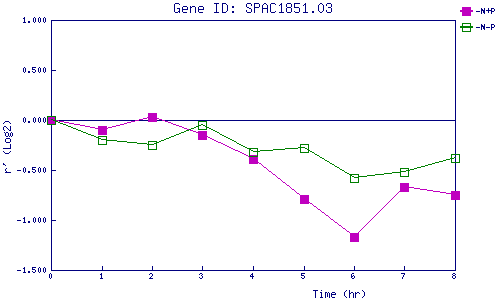
| 0 | 1 | 2 | 3 | 4 | 5 | 6 | 7 | 8 | |
| -N+P | 0.000 | -0.101 | 0.029 | -0.147 | -0.387 | -0.788 | -1.167 | -0.669 | -0.753 |
| -N-P | 0.000 | -0.195 | -0.251 | -0.049 | -0.321 | -0.276 | -0.582 | -0.523 | -0.382 |
|
-N+P: Nitrogen starved in the presence of P-factor -N-P: Nitrogen starved in the absence of P-factor |