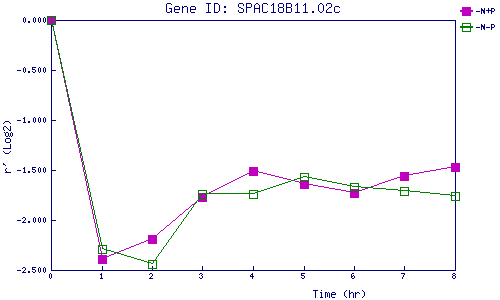
| 0 | 1 | 2 | 3 | 4 | 5 | 6 | 7 | 8 | |
| -N+P | 0.000 | -2.389 | -2.186 | -1.770 | -1.514 | -1.635 | -1.729 | -1.563 | -1.472 |
| -N-P | 0.000 | -2.294 | -2.443 | -1.743 | -1.742 | -1.567 | -1.666 | -1.707 | -1.761 |
|
-N+P: Nitrogen starved in the presence of P-factor -N-P: Nitrogen starved in the absence of P-factor |