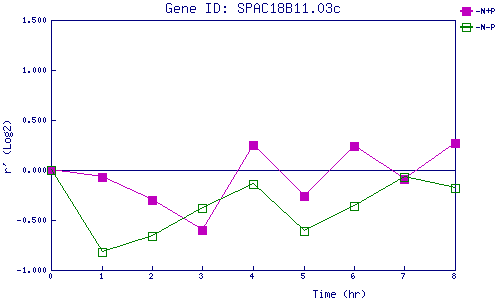
| 0 | 1 | 2 | 3 | 4 | 5 | 6 | 7 | 8 | |
| -N+P | 0.000 | -0.071 | -0.299 | -0.596 | 0.246 | -0.257 | 0.236 | -0.092 | 0.267 |
| -N-P | 0.000 | -0.819 | -0.661 | -0.385 | -0.141 | -0.606 | -0.365 | -0.066 | -0.182 |
|
-N+P: Nitrogen starved in the presence of P-factor -N-P: Nitrogen starved in the absence of P-factor |