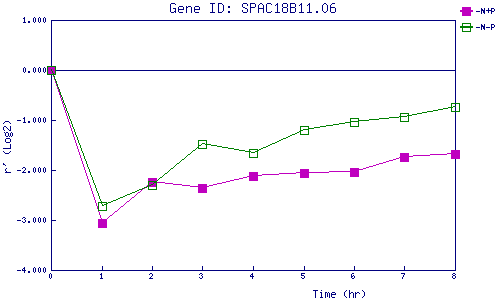
| 0 | 1 | 2 | 3 | 4 | 5 | 6 | 7 | 8 | |
| -N+P | 0.000 | -3.060 | -2.246 | -2.360 | -2.110 | -2.067 | -2.048 | -1.738 | -1.682 |
| -N-P | 0.000 | -2.717 | -2.296 | -1.478 | -1.657 | -1.205 | -1.045 | -0.944 | -0.748 |
|
-N+P: Nitrogen starved in the presence of P-factor -N-P: Nitrogen starved in the absence of P-factor |