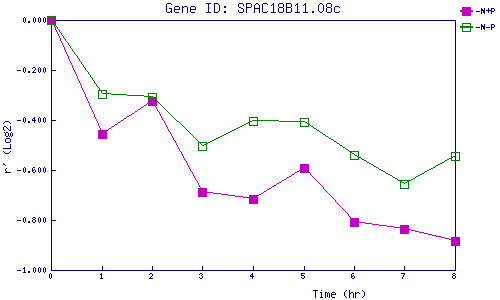
| 0 | 1 | 2 | 3 | 4 | 5 | 6 | 7 | 8 | |
| -N+P | 0.000 | -0.458 | -0.323 | -0.688 | -0.716 | -0.592 | -0.810 | -0.837 | -0.884 |
| -N-P | 0.000 | -0.296 | -0.308 | -0.503 | -0.404 | -0.410 | -0.539 | -0.657 | -0.545 |
|
-N+P: Nitrogen starved in the presence of P-factor -N-P: Nitrogen starved in the absence of P-factor |