tup11
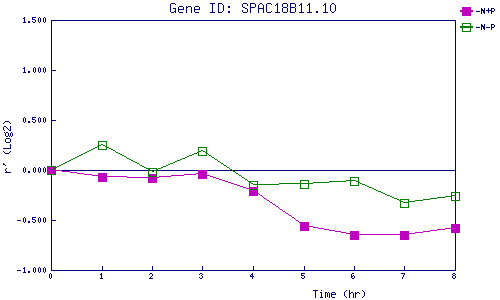
| 0 | 1 | 2 | 3 | 4 | 5 | 6 | 7 | 8 | |
| -N+P | 0.000 | -0.067 | -0.080 | -0.035 | -0.211 | -0.559 | -0.652 | -0.650 | -0.582 |
| -N-P | 0.000 | 0.251 | -0.017 | 0.192 | -0.153 | -0.135 | -0.107 | -0.329 | -0.265 |
|
-N+P: Nitrogen starved in the presence of P-factor -N-P: Nitrogen starved in the absence of P-factor |