chp1
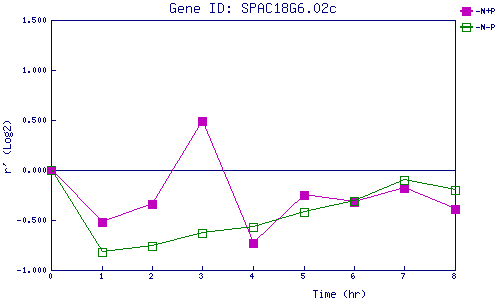
| 0 | 1 | 2 | 3 | 4 | 5 | 6 | 7 | 8 | |
| -N+P | 0.000 | -0.518 | -0.336 | 0.489 | -0.733 | -0.250 | -0.318 | -0.184 | -0.393 |
| -N-P | 0.000 | -0.820 | -0.761 | -0.627 | -0.569 | -0.418 | -0.309 | -0.104 | -0.196 |
|
-N+P: Nitrogen starved in the presence of P-factor -N-P: Nitrogen starved in the absence of P-factor |