| 0 | 1 | 2 | 3 | 4 | 5 | 6 | 7 | 8 | |
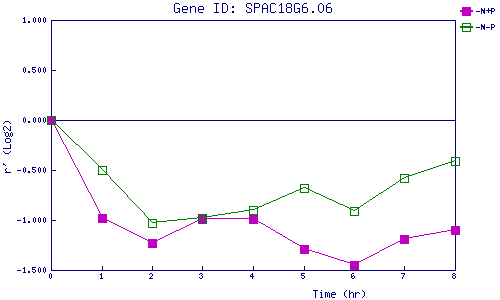
| -N+P | 0.000 | -0.981 | -1.226 | -0.994 | -0.991 | -1.289 | -1.452 | -1.194 | -1.099 |
| -N-P | 0.000 | -0.500 | -1.027 | -0.985 | -0.895 | -0.675 | -0.910 | -0.583 | -0.410 |
|
-N+P: Nitrogen starved in the presence of P-factor -N-P: Nitrogen starved in the absence of P-factor |