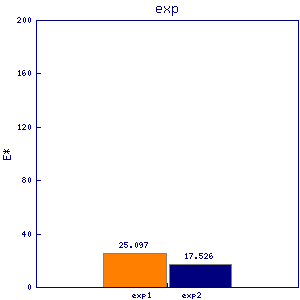
mra1
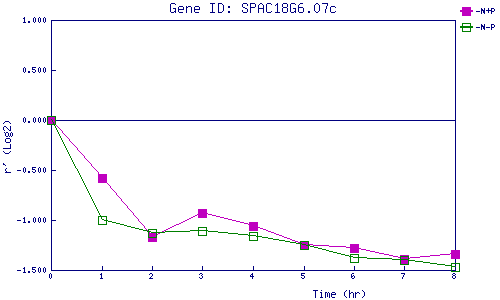
| 0 | 1 | 2 | 3 | 4 | 5 | 6 | 7 | 8 | |
| -N+P | 0.000 | -0.581 | -1.166 | -0.933 | -1.063 | -1.250 | -1.279 | -1.388 | -1.335 |
| -N-P | 0.000 | -0.999 | -1.129 | -1.111 | -1.160 | -1.250 | -1.382 | -1.398 | -1.473 |
|
-N+P: Nitrogen starved in the presence of P-factor -N-P: Nitrogen starved in the absence of P-factor |