rrn3
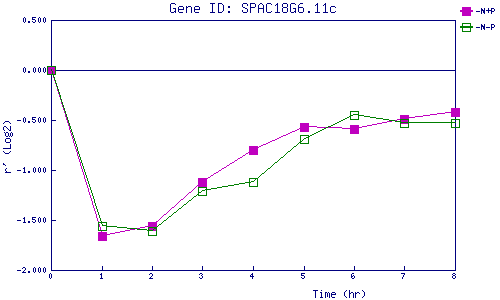
| 0 | 1 | 2 | 3 | 4 | 5 | 6 | 7 | 8 | |
| -N+P | 0.000 | -1.658 | -1.565 | -1.122 | -0.802 | -0.572 | -0.592 | -0.489 | -0.420 |
| -N-P | 0.000 | -1.555 | -1.608 | -1.213 | -1.116 | -0.694 | -0.449 | -0.534 | -0.529 |
|
-N+P: Nitrogen starved in the presence of P-factor -N-P: Nitrogen starved in the absence of P-factor |