mal3
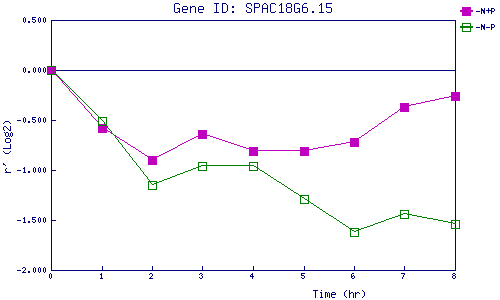
| 0 | 1 | 2 | 3 | 4 | 5 | 6 | 7 | 8 | |
| -N+P | 0.000 | -0.578 | -0.898 | -0.639 | -0.811 | -0.806 | -0.717 | -0.369 | -0.262 |
| -N-P | 0.000 | -0.506 | -1.147 | -0.961 | -0.962 | -1.293 | -1.617 | -1.439 | -1.545 |
|
-N+P: Nitrogen starved in the presence of P-factor -N-P: Nitrogen starved in the absence of P-factor |