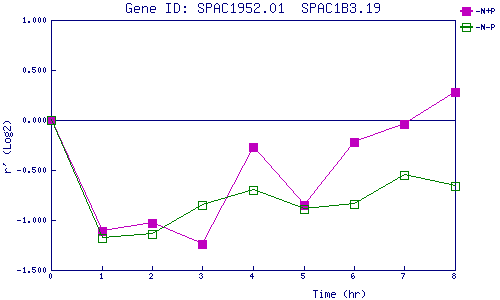
| 0 | 1 | 2 | 3 | 4 | 5 | 6 | 7 | 8 | |
| -N+P | 0.000 | -1.109 | -1.027 | -1.243 | -0.268 | -0.852 | -0.216 | -0.041 | 0.275 |
| -N-P | 0.000 | -1.177 | -1.142 | -0.852 | -0.699 | -0.890 | -0.842 | -0.547 | -0.659 |
|
-N+P: Nitrogen starved in the presence of P-factor -N-P: Nitrogen starved in the absence of P-factor |