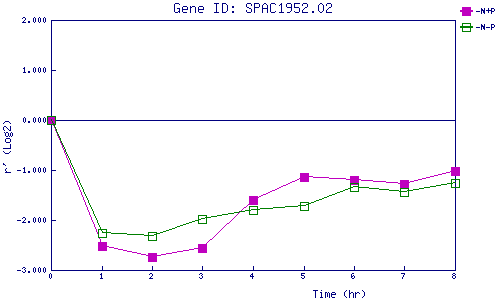
| 0 | 1 | 2 | 3 | 4 | 5 | 6 | 7 | 8 | |
| -N+P | 0.000 | -2.516 | -2.733 | -2.559 | -1.609 | -1.134 | -1.205 | -1.280 | -1.020 |
| -N-P | 0.000 | -2.269 | -2.318 | -1.972 | -1.792 | -1.714 | -1.342 | -1.432 | -1.269 |
|
-N+P: Nitrogen starved in the presence of P-factor -N-P: Nitrogen starved in the absence of P-factor |