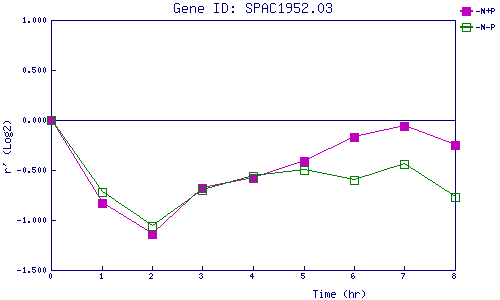
| 0 | 1 | 2 | 3 | 4 | 5 | 6 | 7 | 8 | |
| -N+P | 0.000 | -0.832 | -1.138 | -0.685 | -0.576 | -0.406 | -0.172 | -0.063 | -0.247 |
| -N-P | 0.000 | -0.720 | -1.057 | -0.700 | -0.557 | -0.496 | -0.599 | -0.439 | -0.773 |
|
-N+P: Nitrogen starved in the presence of P-factor -N-P: Nitrogen starved in the absence of P-factor |