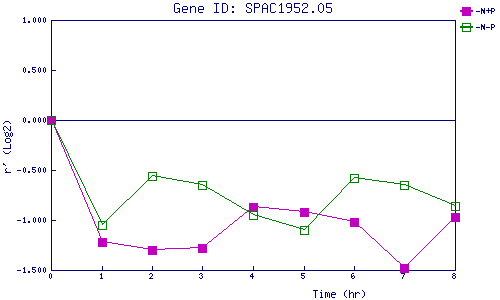
| 0 | 1 | 2 | 3 | 4 | 5 | 6 | 7 | 8 | |
| -N+P | 0.000 | -1.224 | -1.299 | -1.285 | -0.866 | -0.925 | -1.020 | -1.480 | -0.973 |
| -N-P | 0.000 | -1.047 | -0.558 | -0.647 | -0.952 | -1.103 | -0.577 | -0.652 | -0.855 |
|
-N+P: Nitrogen starved in the presence of P-factor -N-P: Nitrogen starved in the absence of P-factor |