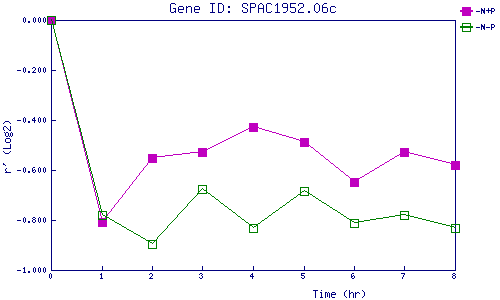
| 0 | 1 | 2 | 3 | 4 | 5 | 6 | 7 | 8 | |
| -N+P | 0.000 | -0.810 | -0.551 | -0.529 | -0.427 | -0.489 | -0.650 | -0.528 | -0.580 |
| -N-P | 0.000 | -0.779 | -0.896 | -0.676 | -0.832 | -0.684 | -0.811 | -0.781 | -0.830 |
|
-N+P: Nitrogen starved in the presence of P-factor -N-P: Nitrogen starved in the absence of P-factor |