rad1
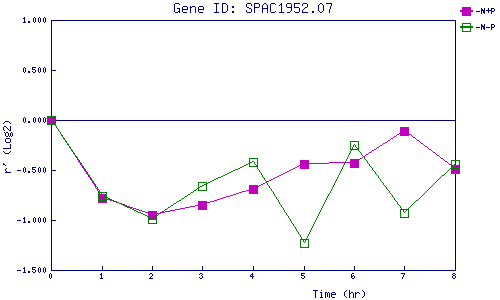
| 0 | 1 | 2 | 3 | 4 | 5 | 6 | 7 | 8 | |
| -N+P | 0.000 | -0.779 | -0.949 | -0.853 | -0.690 | -0.444 | -0.428 | -0.108 | -0.494 |
| -N-P | 0.000 | -0.765 | -0.988 | -0.664 | -0.421 | -1.231 | -0.250 | -0.929 | -0.439 |
|
-N+P: Nitrogen starved in the presence of P-factor -N-P: Nitrogen starved in the absence of P-factor |