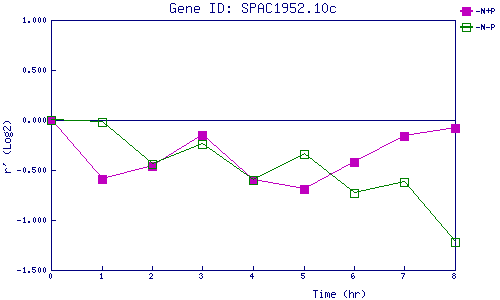
| 0 | 1 | 2 | 3 | 4 | 5 | 6 | 7 | 8 | |
| -N+P | 0.000 | -0.592 | -0.456 | -0.147 | -0.602 | -0.691 | -0.425 | -0.163 | -0.081 |
| -N-P | 0.000 | -0.015 | -0.440 | -0.241 | -0.599 | -0.336 | -0.733 | -0.620 | -1.219 |
|
-N+P: Nitrogen starved in the presence of P-factor -N-P: Nitrogen starved in the absence of P-factor |