csn71 csn7a csn7
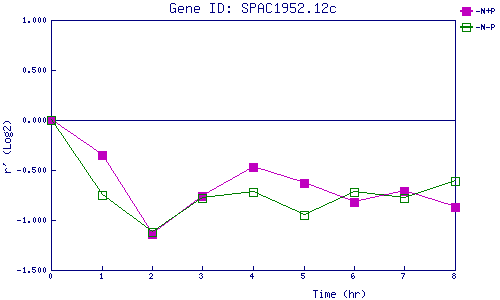
| 0 | 1 | 2 | 3 | 4 | 5 | 6 | 7 | 8 | |
| -N+P | 0.000 | -0.349 | -1.139 | -0.765 | -0.472 | -0.634 | -0.823 | -0.706 | -0.874 |
| -N-P | 0.000 | -0.752 | -1.119 | -0.779 | -0.718 | -0.951 | -0.724 | -0.776 | -0.613 |
|
-N+P: Nitrogen starved in the presence of P-factor -N-P: Nitrogen starved in the absence of P-factor |