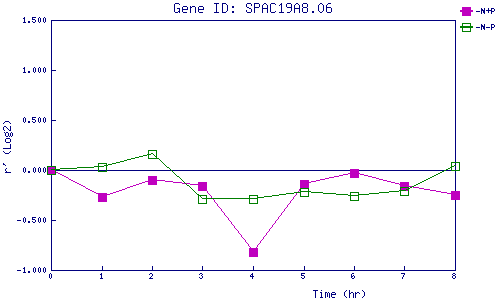
| 0 | 1 | 2 | 3 | 4 | 5 | 6 | 7 | 8 | |
| -N+P | 0.000 | -0.268 | -0.105 | -0.158 | -0.824 | -0.135 | -0.031 | -0.157 | -0.248 |
| -N-P | 0.000 | 0.029 | 0.163 | -0.291 | -0.292 | -0.224 | -0.258 | -0.213 | 0.035 |
|
-N+P: Nitrogen starved in the presence of P-factor -N-P: Nitrogen starved in the absence of P-factor |