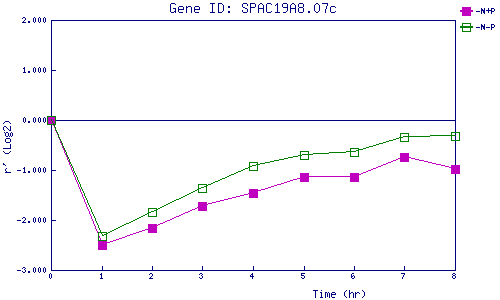
| 0 | 1 | 2 | 3 | 4 | 5 | 6 | 7 | 8 | |
| -N+P | 0.000 | -2.503 | -2.163 | -1.720 | -1.457 | -1.135 | -1.135 | -0.746 | -0.984 |
| -N-P | 0.000 | -2.316 | -1.845 | -1.359 | -0.928 | -0.702 | -0.632 | -0.342 | -0.310 |
|
-N+P: Nitrogen starved in the presence of P-factor -N-P: Nitrogen starved in the absence of P-factor |