| 0 | 1 | 2 | 3 | 4 | 5 | 6 | 7 | 8 | |
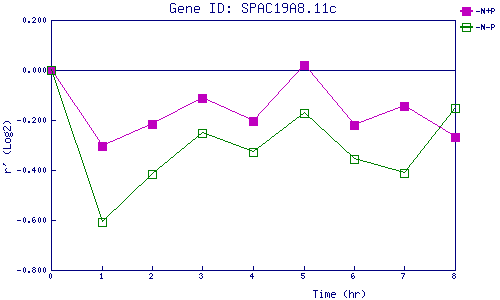
| -N+P | 0.000 | -0.304 | -0.214 | -0.113 | -0.203 | 0.019 | -0.220 | -0.142 | -0.267 |
| -N-P | 0.000 | -0.609 | -0.415 | -0.253 | -0.329 | -0.173 | -0.357 | -0.411 | -0.153 |
|
-N+P: Nitrogen starved in the presence of P-factor -N-P: Nitrogen starved in the absence of P-factor |