| 0 | 1 | 2 | 3 | 4 | 5 | 6 | 7 | 8 | |
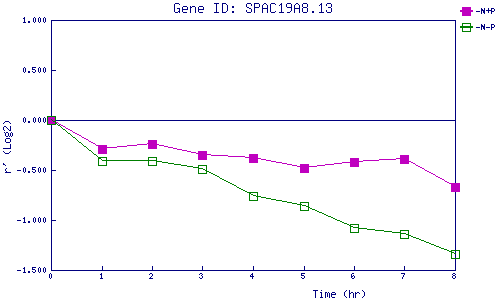
| -N+P | 0.000 | -0.294 | -0.237 | -0.349 | -0.379 | -0.477 | -0.425 | -0.391 | -0.672 |
| -N-P | 0.000 | -0.413 | -0.411 | -0.493 | -0.765 | -0.855 | -1.078 | -1.138 | -1.339 |
|
-N+P: Nitrogen starved in the presence of P-factor -N-P: Nitrogen starved in the absence of P-factor |