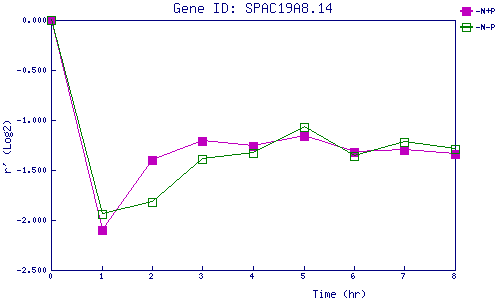
| 0 | 1 | 2 | 3 | 4 | 5 | 6 | 7 | 8 | |
| -N+P | 0.000 | -2.099 | -1.401 | -1.206 | -1.264 | -1.161 | -1.325 | -1.302 | -1.337 |
| -N-P | 0.000 | -1.937 | -1.823 | -1.387 | -1.330 | -1.070 | -1.360 | -1.219 | -1.293 |
|
-N+P: Nitrogen starved in the presence of P-factor -N-P: Nitrogen starved in the absence of P-factor |