trp2
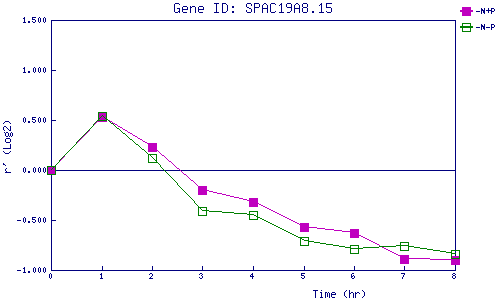
| 0 | 1 | 2 | 3 | 4 | 5 | 6 | 7 | 8 | |
| -N+P | 0.000 | 0.531 | 0.230 | -0.203 | -0.317 | -0.573 | -0.629 | -0.892 | -0.903 |
| -N-P | 0.000 | 0.539 | 0.120 | -0.409 | -0.454 | -0.714 | -0.788 | -0.762 | -0.837 |
|
-N+P: Nitrogen starved in the presence of P-factor -N-P: Nitrogen starved in the absence of P-factor |