bgs3
| 0 | 1 | 2 | 3 | 4 | 5 | 6 | 7 | 8 | |
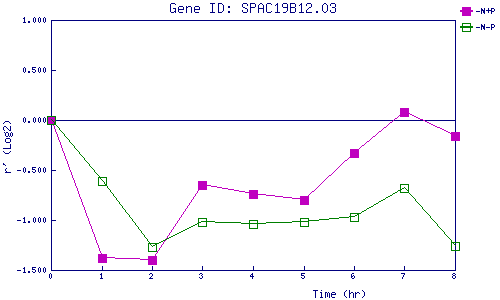
| -N+P | 0.000 | -1.381 | -1.397 | -0.651 | -0.743 | -0.801 | -0.332 | 0.085 | -0.160 |
| -N-P | 0.000 | -0.613 | -1.269 | -1.024 | -1.042 | -1.020 | -0.970 | -0.681 | -1.260 |
|
-N+P: Nitrogen starved in the presence of P-factor -N-P: Nitrogen starved in the absence of P-factor |