rps30-1 rps3001
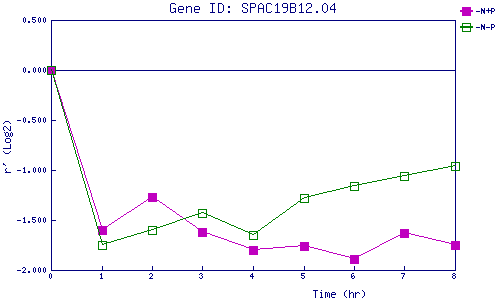
| 0 | 1 | 2 | 3 | 4 | 5 | 6 | 7 | 8 | |
| -N+P | 0.000 | -1.602 | -1.270 | -1.623 | -1.797 | -1.755 | -1.886 | -1.631 | -1.754 |
| -N-P | 0.000 | -1.746 | -1.597 | -1.426 | -1.647 | -1.276 | -1.155 | -1.062 | -0.961 |
|
-N+P: Nitrogen starved in the presence of P-factor -N-P: Nitrogen starved in the absence of P-factor |