srp14
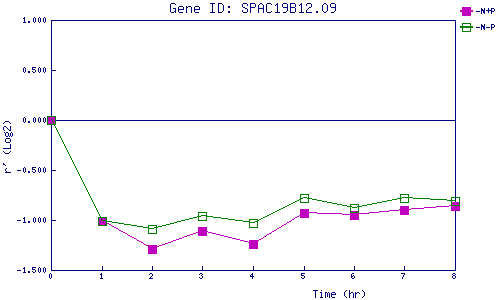
| 0 | 1 | 2 | 3 | 4 | 5 | 6 | 7 | 8 | |
| -N+P | 0.000 | -1.007 | -1.291 | -1.107 | -1.245 | -0.926 | -0.947 | -0.898 | -0.855 |
| -N-P | 0.000 | -1.014 | -1.091 | -0.959 | -1.032 | -0.782 | -0.879 | -0.776 | -0.812 |
|
-N+P: Nitrogen starved in the presence of P-factor -N-P: Nitrogen starved in the absence of P-factor |