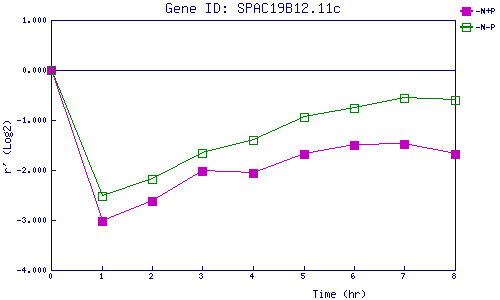
| 0 | 1 | 2 | 3 | 4 | 5 | 6 | 7 | 8 | |
| -N+P | 0.000 | -3.024 | -2.625 | -2.021 | -2.054 | -1.691 | -1.506 | -1.480 | -1.688 |
| -N-P | 0.000 | -2.523 | -2.174 | -1.653 | -1.391 | -0.947 | -0.755 | -0.564 | -0.593 |
|
-N+P: Nitrogen starved in the presence of P-factor -N-P: Nitrogen starved in the absence of P-factor |