| 0 | 1 | 2 | 3 | 4 | 5 | 6 | 7 | 8 | |
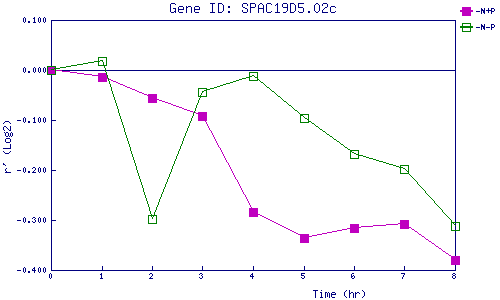
| -N+P | 0.000 | -0.014 | -0.057 | -0.092 | -0.283 | -0.335 | -0.315 | -0.308 | -0.381 |
| -N-P | 0.000 | 0.018 | -0.298 | -0.045 | -0.012 | -0.095 | -0.169 | -0.198 | -0.313 |
|
-N+P: Nitrogen starved in the presence of P-factor -N-P: Nitrogen starved in the absence of P-factor |