| 0 | 1 | 2 | 3 | 4 | 5 | 6 | 7 | 8 | |
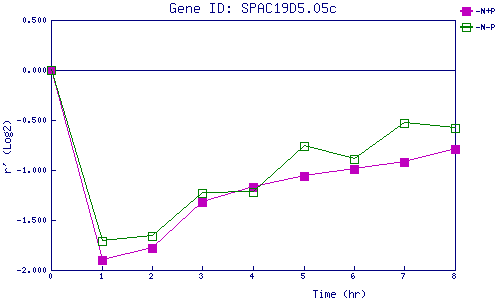
| -N+P | 0.000 | -1.902 | -1.780 | -1.323 | -1.168 | -1.059 | -0.994 | -0.916 | -0.789 |
| -N-P | 0.000 | -1.711 | -1.662 | -1.226 | -1.220 | -0.760 | -0.893 | -0.534 | -0.577 |
|
-N+P: Nitrogen starved in the presence of P-factor -N-P: Nitrogen starved in the absence of P-factor |