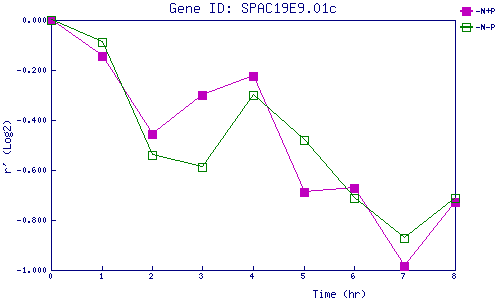
| 0 | 1 | 2 | 3 | 4 | 5 | 6 | 7 | 8 | |
| -N+P | 0.000 | -0.143 | -0.454 | -0.299 | -0.222 | -0.688 | -0.672 | -0.985 | -0.729 |
| -N-P | 0.000 | -0.089 | -0.541 | -0.587 | -0.299 | -0.479 | -0.713 | -0.873 | -0.711 |
|
-N+P: Nitrogen starved in the presence of P-factor -N-P: Nitrogen starved in the absence of P-factor |