cut20 lid1
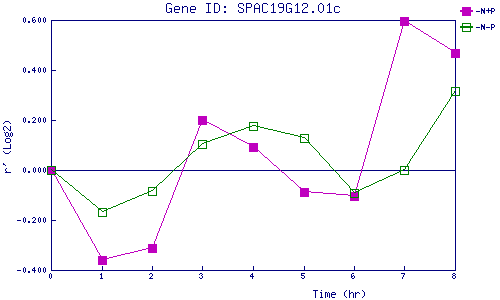
| 0 | 1 | 2 | 3 | 4 | 5 | 6 | 7 | 8 | |
| -N+P | 0.000 | -0.362 | -0.311 | 0.200 | 0.092 | -0.089 | -0.102 | 0.595 | 0.469 |
| -N-P | 0.000 | -0.170 | -0.083 | 0.104 | 0.176 | 0.126 | -0.092 | 0.001 | 0.316 |
|
-N+P: Nitrogen starved in the presence of P-factor -N-P: Nitrogen starved in the absence of P-factor |