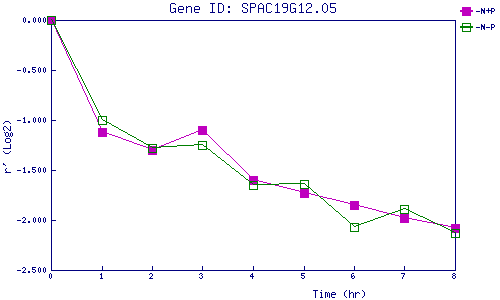
| 0 | 1 | 2 | 3 | 4 | 5 | 6 | 7 | 8 | |
| -N+P | 0.000 | -1.123 | -1.296 | -1.103 | -1.597 | -1.728 | -1.846 | -1.984 | -2.085 |
| -N-P | 0.000 | -0.997 | -1.275 | -1.253 | -1.654 | -1.644 | -2.071 | -1.894 | -2.129 |
|
-N+P: Nitrogen starved in the presence of P-factor -N-P: Nitrogen starved in the absence of P-factor |