coq1
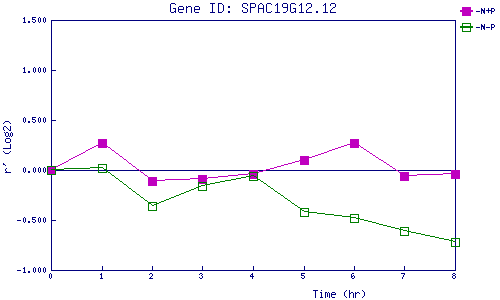
| 0 | 1 | 2 | 3 | 4 | 5 | 6 | 7 | 8 | |
| -N+P | 0.000 | 0.272 | -0.113 | -0.092 | -0.044 | 0.100 | 0.274 | -0.059 | -0.040 |
| -N-P | 0.000 | 0.021 | -0.356 | -0.158 | -0.057 | -0.417 | -0.478 | -0.607 | -0.720 |
|
-N+P: Nitrogen starved in the presence of P-factor -N-P: Nitrogen starved in the absence of P-factor |