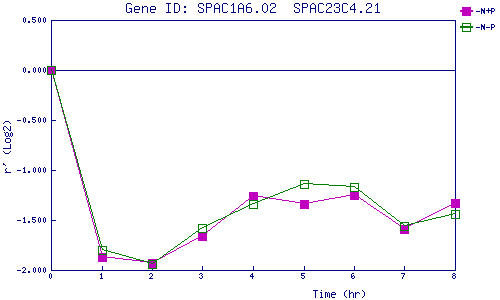
| 0 | 1 | 2 | 3 | 4 | 5 | 6 | 7 | 8 | |
| -N+P | 0.000 | -1.871 | -1.928 | -1.656 | -1.258 | -1.342 | -1.247 | -1.591 | -1.330 |
| -N-P | 0.000 | -1.804 | -1.939 | -1.581 | -1.338 | -1.142 | -1.172 | -1.565 | -1.438 |
|
-N+P: Nitrogen starved in the presence of P-factor -N-P: Nitrogen starved in the absence of P-factor |