plb1
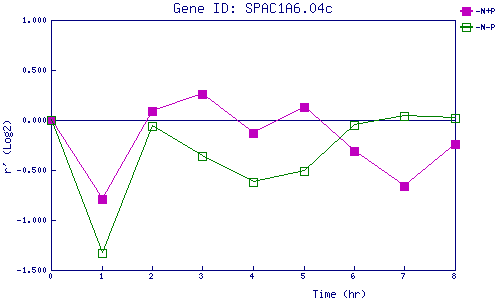
| 0 | 1 | 2 | 3 | 4 | 5 | 6 | 7 | 8 | |
| -N+P | 0.000 | -0.791 | 0.094 | 0.260 | -0.126 | 0.129 | -0.312 | -0.655 | -0.235 |
| -N-P | 0.000 | -1.334 | -0.063 | -0.359 | -0.622 | -0.506 | -0.051 | 0.035 | 0.015 |
|
-N+P: Nitrogen starved in the presence of P-factor -N-P: Nitrogen starved in the absence of P-factor |